import numpy as np
import matplotlib.pyplot as plt

r = np.arange(0, 2, 0.01)
theta = 2 * np.pi * r
fig, ax = plt.subplots(
  subplot_kw = {'projection': 'polar'}
)
ax.plot(theta, r)
ax.set_rticks([0.5, 1, 1.5, 2])
ax.grid(True)
plt.show()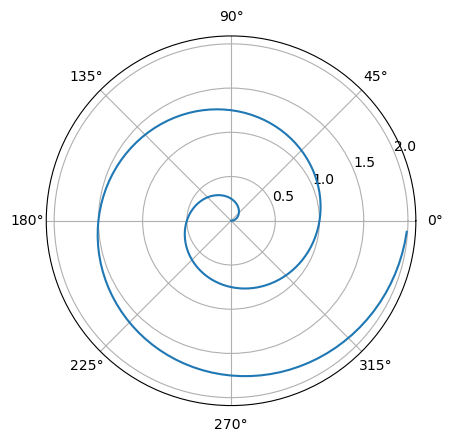
This article is written in Jupyter Notebook and converted to HTML using Quarto.
For a demonstration of a line plot on a polar axis, see Figure 1.
import numpy as np
import matplotlib.pyplot as plt
r = np.arange(0, 2, 0.01)
theta = 2 * np.pi * r
fig, ax = plt.subplots(
subplot_kw = {'projection': 'polar'}
)
ax.plot(theta, r)
ax.set_rticks([0.5, 1, 1.5, 2])
ax.grid(True)
plt.show()import plotly.express as px
import plotly.io as pio
pio.renderers.default = "plotly_mimetype+notebook_connected"
df = px.data.iris()
fig = px.scatter(df, x="sepal_width", y="sepal_length",
color="species",
marginal_y="violin", marginal_x="box",
trendline="ols", template="simple_white")
fig.show()from ipyleaflet import Map, Marker, basemaps, basemap_to_tiles
m = Map(
basemap=basemap_to_tiles(
basemaps.NASAGIBS.ModisTerraTrueColorCR, "2017-04-08"
),
center=(52.204793, 360.121558),
zoom=4
)
m.add_layer(Marker(location=(52.204793, 360.121558)))
m